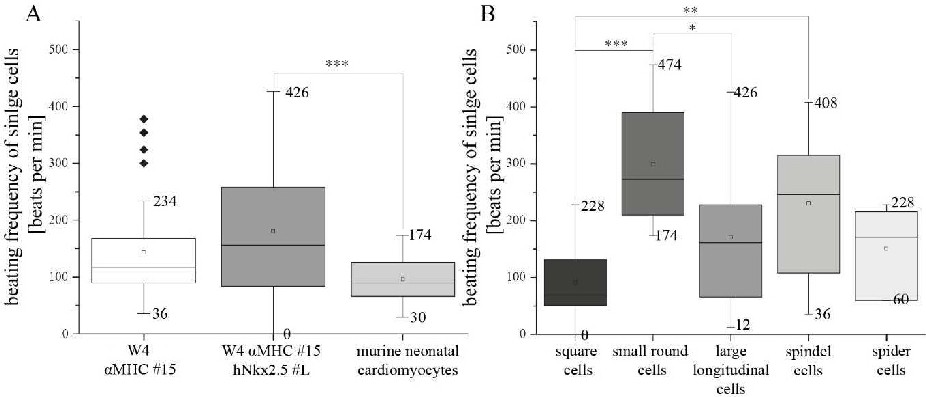
Fig. 5. Beating frequencies of obtained CM-like single cells: Analysis of beating frequencies of CM-like single cells on day 25 of differentiation and murine neonatal cardiomyocytes. (A) Beating frequencies of single cells (excluding small round dying cells) as well as murine neonatal CM and (B) further W4 αMHC hNkx2.5 subdivision on basis of morphological distinction (including small round dying cells) displayed as boxplots, with 25 %- and 75 %-quantil, coeff. 1.5, outliers marked, horizontal line indicates media, square indicates mean; A: n=38, 88, 32 and B: n=16, 8, 33, 16, 6. Statistics were performed as multiple comparison of mean (ANOVA), ***p ≤ 0.001.